Creates Tables of Individual Observations from PKNCA Result
Source:R/NCA_Server.R
mk_table_ind_obs.RdTakes the output of PKNCA and creates a tabular view of the individual observation data. This can be spread out of over several tables (pages) if necessary.
Usage
mk_table_ind_obs(
  nca_res,
  obnd = NULL,
  flag_map = list(),
  digits = 3,
  text_format = "text",
  max_height = 7,
  max_width = 6.5,
  max_row = 17,
  max_col = 9,
  notes_detect = NULL,
  rows_by = "time"
)
Arguments
- nca_res
Output of PKNCA.
- obnd
onbrand reporting object.
- flag_map
List with flag mapping detials
- digits
Number of significant figures to report (set to
NULLto disable rounding)- text_format
Either
"md"for markdown or"text"(default) for plain text.- max_height
Maximum height of the final table in inches (A value of
NULLwill use 100 inches).- max_width
Maximum width of the final table in inches (A value of
NULLwill use 100 inches).- max_row
Maximum number of rows to have on a page. Spillover will hang over the side of the page..
- max_col
Maximum number of columns to have on a page. Spillover will be wrapped to multiple pages.
- notes_detect
Vector of strings to detect in output tables (example
c("NC", "BLQ")). If set to NULL it will attempt to extract notes for NC, NS and BLQ from the flag_map input.- rows_by
Can be either "time" or "id". If it is "time", there will be a column for time and separate column for each subject ID. If rows_by is set to "id" there will be a column for ID and a column for each individual time.
Value
List containing the following elements
isgood: Boolean indicating the exit status of the function.
one_table: Dataframe of the entire table with the first lines containing the header.
one_body: Dataframe of the entire table (data only).
one_header: Dataframe of the entire header (row and body, no data).
tables: Named list of tables. Each list element is of the output
msgs: Vector of text messages describing any errors that were found. format from
build_span.
Examples
library(dplyr)
library(stringr)
library(ruminate)
library(PKNCA)
library(formods)
if(formods::is_installed("readxl")){
library(readxl)
# Reporting object
rpt = onbrand::read_template(
template = file.path(system.file(package = "onbrand"), "templates", "report.docx"),
mapping = file.path(system.file(package = "onbrand"), "templates", "report.yaml")
)
# metadata about NCA parameters
nps = NCA_fetch_np_meta()[["summary"]]
# Datafile with only 3 subjects for the example
data_file = system.file(package="formods","test_data","TEST_DATA.xlsx")
myDS = readxl::read_excel(path=data_file, sheet="DATA") |>
dplyr::filter(EVID == 0) |>
dplyr::filter(str_detect(string=Cohort, "^SD")) |>
dplyr::filter(CMT == "C_ng_ml")
# First three subjects for the example
myDS = myDS |>
dplyr::filter(ID %in% unique(myDS$ID)[1:3])
# This contains flags used in functions below.
# - manual indicates that it can be assinged with manual point selection.
# This SHOULD NOT BE CHANGED
# - color color used when plotting flagged points
# - sn short name used in table to identify flagged points
# - description short description used in figure legends
# - notes notes that go at the bottom of tables
flag_map = list(
reset = list(
manual = "yes",
color = "black",
sn = "NF",
description = "No Flag",
notes = "reset point/selection to dataset default"
),
obs = list(
manual = "no",
color = "black",
sn = "OBS",
description = "Observation",
notes = "normal observation"
),
blq = list(
manual = "no",
color = "#56B4E9",
sn = "BLQ",
description = "BLQ",
notes = "below the level of quantification"
),
hlex = list(
manual = "yes",
color = "#F0E441",
sn = "HX",
description = "Exclude Half-life",
notes = "exclude from half-life calculation"
),
hlin = list(
manual = "yes",
color = "#029E73",
sn = "HI",
description = "Specify Half-life",
notes = "specified for inclusion in half-life calculation"
),
censor = list(
manual = "yes",
color = "#D65E00",
sn = "C",
description = "Censored",
notes = "censored from analysis"
),
ns = list(
manual = "no",
color = "black",
sn = "NS",
description = "Not Sampled",
notes = "not calculated"
),
nc = list(
manual = "no",
color = "black",
sn = "NC",
description = "Not Calclated",
notes = "not calculated"
)
)
# Creating column mapping
col_map = list(
col_id = c("ID"),
col_dose = c("DOSE"),
col_conc = c("DV"),
col_dur = NULL,
col_analyte = c("CMT"),
col_route = c("ROUTE"),
col_time = c("TIME_DY"),
col_ntime = c("NTIME_DY"),
col_group = NULL,
col_evid = c("EVID"),
col_cycle = c("DOSE_NUM")
)
# This flags specific rows in the source dataset based
# on the row number. See flag_map for possible flags
# (those that include manual="yes"). To
# remove a flag just delete the row.
ds_flags = dplyr::tribble(
~key, ~flag, ~note,
"rec_3", "censor", "worst point",
"rec_7", "hlex", "bad point"
)
# Defining patterns to look for different ways routes were specified.
route_map = list(
intravascular = c("^(?i)iv$"),
extravascular = c("^(?i)sc$", "^(?i)oral")
)
myDS = apply_route_map(route_map = route_map,
route_col = "ROUTE",
DS = myDS)
utils::head(myDS[["ROUTE"]])
# Extracting dosing records from the dataset
dose_rec = dose_records_builder(
NCA_DS = myDS,
col_map = col_map,
dose_from = "cols")[["dose_rec"]]
# Applying the flags to the dataset
conc_DS =
flag_nca_ds(
DS = myDS,
flag_map = flag_map,
col_map = col_map,
ds_flags = ds_flags)
nca_dose = PKNCA::PKNCAdose(dose_rec, DOSE~TIME_DY|ID, route = "ROUTE")
# NCA concentration object
nca_conc = PKNCA::PKNCAconc(
data = conc_DS,
formula = DV~TIME_DY|ID/CMT,
time.nominal = "NTIME_DY",
sparse = FALSE,
exclude_half.life = "rmnt_hlex",
include_half.life = "rmnt_hlin",
exclude = "rmnt_cens"
)
# NCA units table
nca_units =
PKNCA::pknca_units_table(
concu = "ng/mL",
doseu = "mg",
amountu = "mg",
timeu = "day")
# Analysis intervals
nca_intervals =
data.frame(
start = c(0, 0),
end = c(Inf, 21),
half.life = c(TRUE, FALSE),
aucinf.obs = c(TRUE, FALSE),
cmax = c(FALSE, TRUE),
auclast = c(FALSE, TRUE)
)
# Data packaged up for PKNCA
nca_data = PKNCA::PKNCAdata(
data.conc = nca_conc,
data.dose = nca_dose,
intervals = nca_intervals,
units = nca_units)
# Running NCA
nca_res = PKNCA::pk.nca(nca_data)
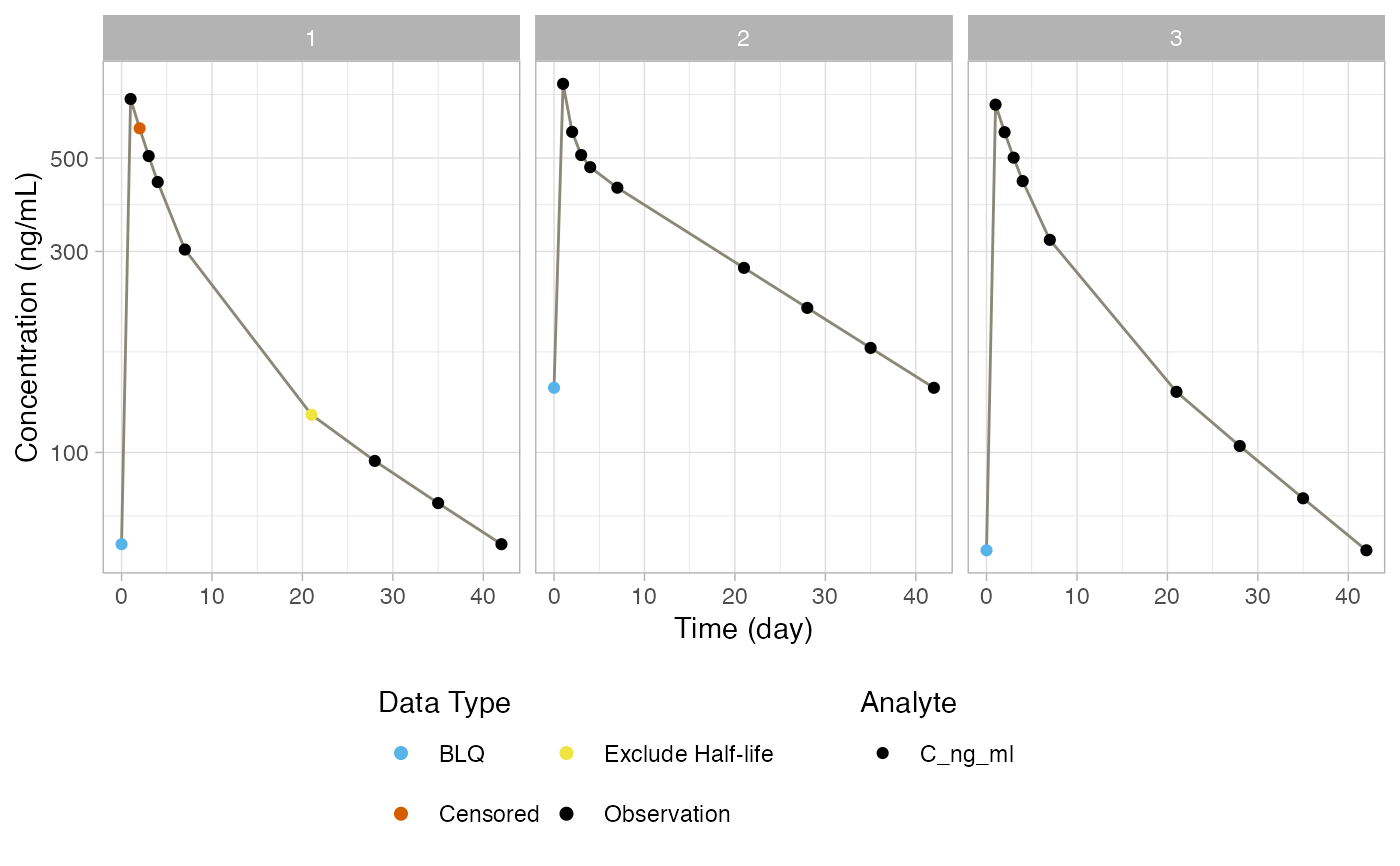
# Generating figures of indiviudal profiles
figure_ind_obs = mk_figure_ind_obs(
nca_res,
time_units = "day",
conc_units = "ng/mL",
col_map = col_map,
flag_map = flag_map,
nfrows = 4,
nfcols = 4,
log_scale = TRUE)
# Generating tables of the concentration data
table_ind_obs = mk_table_ind_obs(
nca_res = nca_res,
obnd = rpt,
flag_map = flag_map,
digits = 3)
table_ind_obs$tables[["Table 1"]]$ft
# Generating tables of the manual flags applied
table_ind_obs_flags = mk_table_ind_obs_flags(
nca_res = nca_res,
obnd = rpt,
flag_map = flag_map,
digits = 3)
table_ind_obs_flags$tables[["Table 1"]]$ft
# Generating tables of individual parameters
table_ind_params = mk_table_nca_params(
nca_res = nca_res,
obnd = rpt,
flag_map = flag_map,
nps = nps,
text_format = "md",
digits = 3)
print(figure_ind_obs$figures$Figure_1$gg)
table_ind_params$tables[["Table 1"]]$ft
}
#> Warning: Ignoring unknown aesthetics: text
ID
CMT
AUClast
Cmax
AUCinf,obs
thalf
day*ng/mL
ng/mL
day*ng/mL
day
[0,21]
[0,inf]
1
C_ng_ml
5,900
690
9,590
21.3
2
C_ng_ml
8,240
750
17,000
22.2
3
C_ng_ml
6,140
670
9,520
17.0